|
Associated and Non-Associated Document |
  
|
| Show/Hide Hidden Text |
|
Associated and Non-Associated Document |
|
| Show/Hide Hidden Text |
Graphical representation of Associated and Non-Associated Document Report is as follows:
Definition of the Report: Allows generating a pie chart showing you Associated and Non-Associated Documents (if exists). Clicking on Associated or Non-Associated Pie will open another Pie Chart showing you Associated or Non-Associated Documents based on Document Type. Clicking on that Pie Chart will open a tabular form with the document details. Images showing the sample graphical representation are displayed as follows.
Report Viewer form opens. Set the filers as per your requirement to generate the report and click on View Report button.
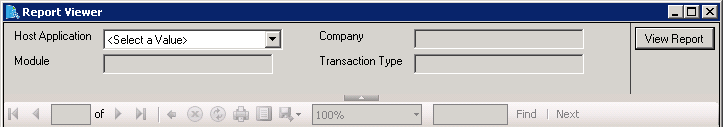
Figure 1: Pie Chart showing No. of Associated and Non-Associated Documents as per the Transaction Type
 |
| Click on image to magnify/shrink |
Figure 2: Pie Chart showing the No. of Associated or Non-Associated Documents as per the Document Type
 |
| Click on image to magnify/shrink |
Figure 3: Tabular chart showing the Document Details for Associated or Non-Associated Documents
 |
| Click on image to magnify/shrink |