|
Workflow Items Summary by Queue |
  
|
| Show/Hide Hidden Text |
|
Workflow Items Summary by Queue |
|
| Show/Hide Hidden Text |
Graphical representation of Workflow Items Summary By Queue Report is as follows:
Definition of the Report: Allows generating a Bar Chart showing the no. of Workflow Items Summary By Queue. Clicking on the Bar opens a Pie Chart showing the no. of Queues by State. Clicking on Pie opens a Tabular Chart with detailed information of the Workflow Items. Images showing the sample graphical representation for all is as follows.
Report Viewer form opens. Select the Workflow from the drop-down list and set Show Completed Items as True or False and click on View Report button.
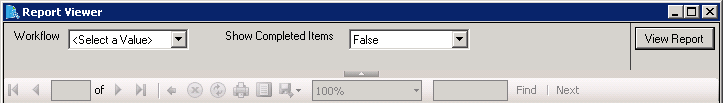
Figure 1: Showing the Bar Chart for Workflow Items Summary by Queue
 |
| Click on image to magnify/shrink |
Figure 2: Showing the Pie Chart for Workflow Items Summary in Queue by State
 |
| Click on image to magnify/shrink |
Figure 3: Showing the Tabular Chart with Workflow Item Details
 |
| Click on image to magnify/shrink |