|
Recently Associated Workflow Item Summary |
  
|
| Show/Hide Hidden Text |
|
Recently Associated Workflow Item Summary |
|
| Show/Hide Hidden Text |
Graphical representation of Recently Associated Workflow Item Summary Report is as follows:
Definition of the Report: Allows generating a Pie Chart showing the no. of recently associated Workflow Item summary. Clicking on the pie opens a tabular chart with detailed information of the documents. Images showing the sample graphical representation for all is as follows.
Report Viewer form opens. Enter the no. of days in the available text-box and click on View Report button. Default value for no. of days would be 1.
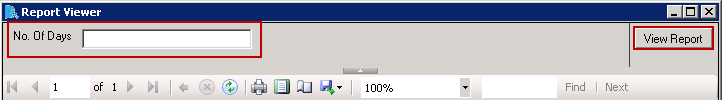
Figure 1: Showing the Pie Chart of Recently Associated Workflow Item Summary
 |
| Click on image to magnify/shrink |
Figure 2: Showing the Tabular Chart for Recently Associated Workflow Item Details
 |
| Click on image to magnify/shrink |