|
Scan Later Pending Documents Summary by Transaction Type |
  
|
| Show/Hide Hidden Text |
|
Scan Later Pending Documents Summary by Transaction Type |
|
| Show/Hide Hidden Text |
Graphical representation of Scan Later Pending Documents Summary by Transaction Type Report is as follows:
Definition of the Report: Allows generating a Column Chart showing the no. of Scan Later Pending Documents Summary by Transaction Type. Clicking on the Column opens a Pie Chart showing the no. of scan later pending documents by Document Type. Clicking on the pie opens a tabular chart with detailed information of the documents. Images showing the sample graphical representation for all is as follows.
Report Viewer form opens. Select the Host Application and the respective Company from the drop-down list and click on View Report button.
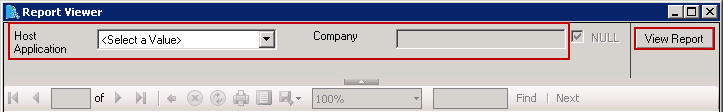
Figure 1: Showing the Column Chart of Scan Later Pending Documents Summary by Transaction Type
 |
| Click on image to magnify/shrink |
Figure 2: Showing the Pie Chart for the No. of Scan Later Pending Documents by Document Type
 |
| Click on image to magnify/shrink |
Figure 3: Showing the Tabular Chart for Scan Later Pending Documents Details
 |
| Click on image to magnify/shrink |